The Magnetics in power applications, whether in the AC/DC supply or DC/DC supply, start changing when the frequencies go above 400KHz. This is primarily due to the different components of core loss. Core loss is describe as a combination of hysterysis and eddy current losses given by the general formula:
Pv = Ph + Pe  where

Ph = K1 x f x B

Pe = K2 x f² x B²

( K1 and K2 are core constants)
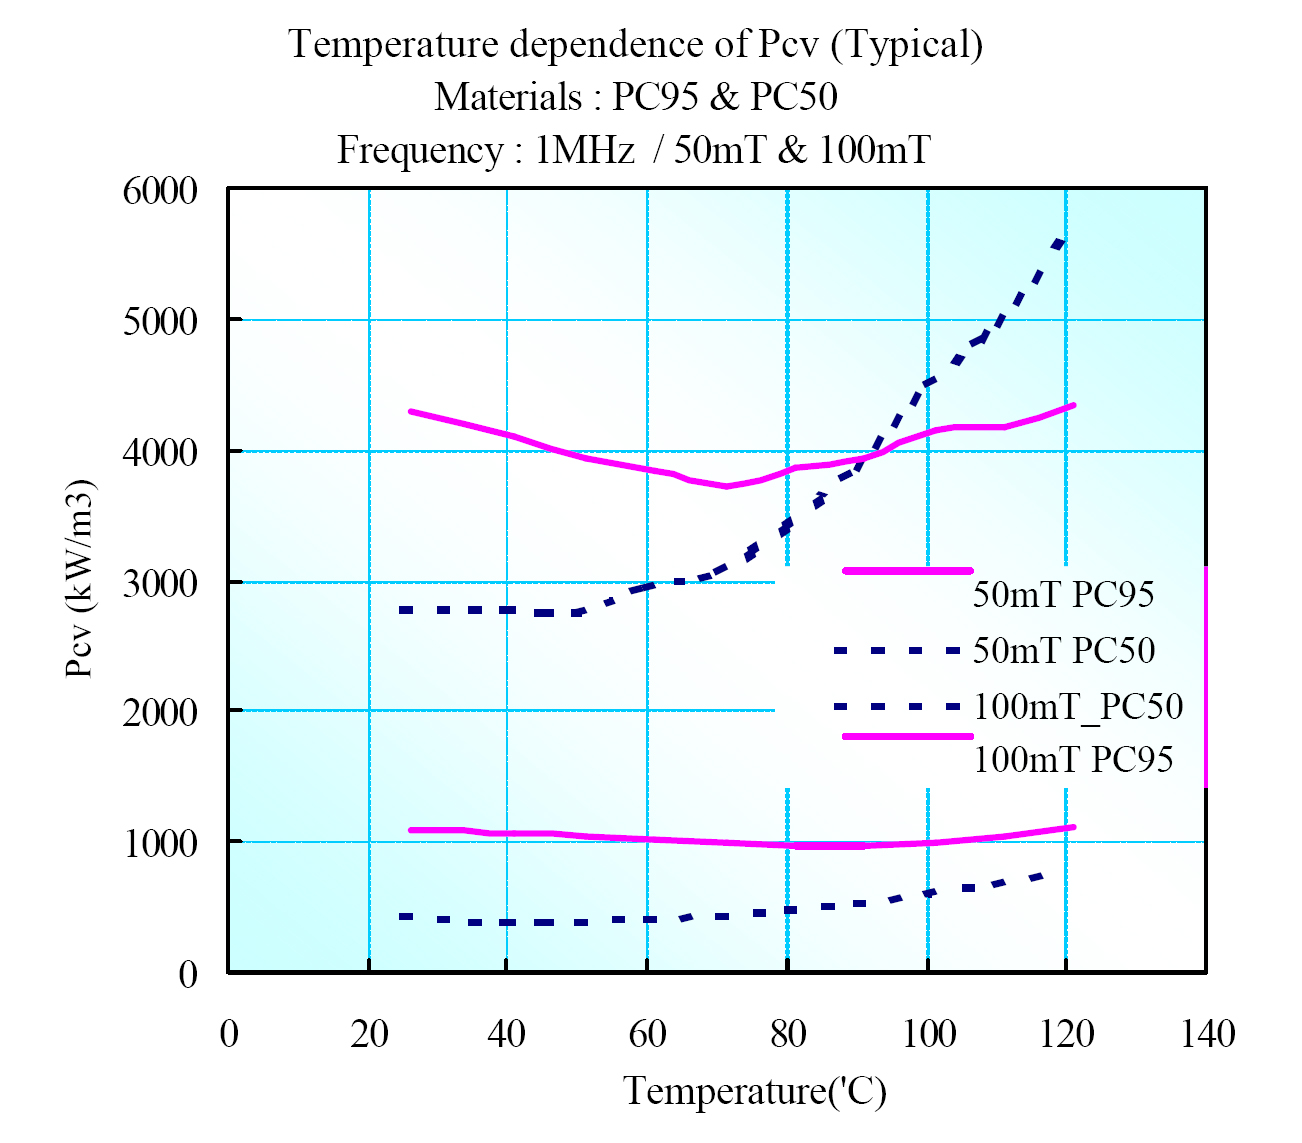
This indicates that the core loss increases expotentially as the frequency and the flux increase. As a result, the ferrite material for use in the high frequency range above 400KHz must be specfically formulated to control Eddy current losses due to the frequency and the flux. The first materials design for use in this frequency range were the TDK PC50 and the Epcos N49. These were design for power applications at high frequency and lower flux densities. Power designs at these frequencies were expected to keep the operating flux densities in the 50mT range. As technologies have progressed, power supply design engineers have been pushing the frequency and the operating flux. 400KHz – 600KHz at 80mT – 120mT are becoming the norm. PC50/B49 is no longer the material of choice under these conditions. With introduction of the PC95 material, not only do we have a flat core loss curve over temperature, we also have the additional benefit of this new ferrite material of lower losses at high frequencies and higher flux densities.
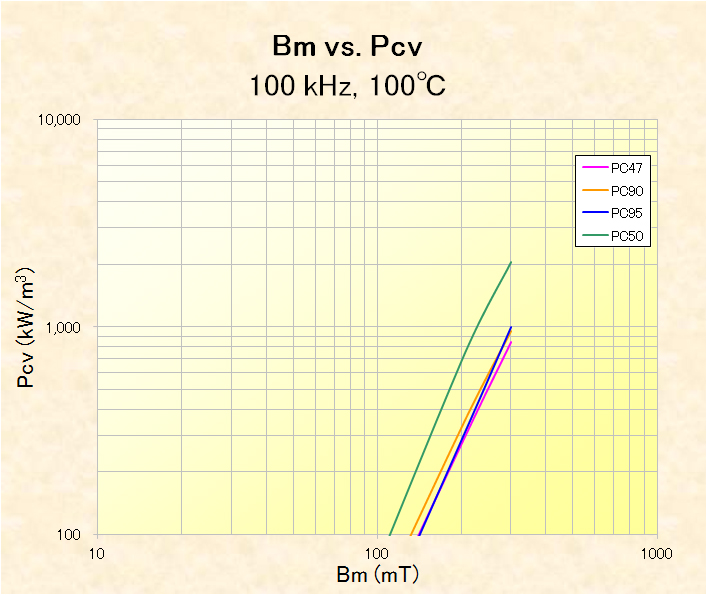
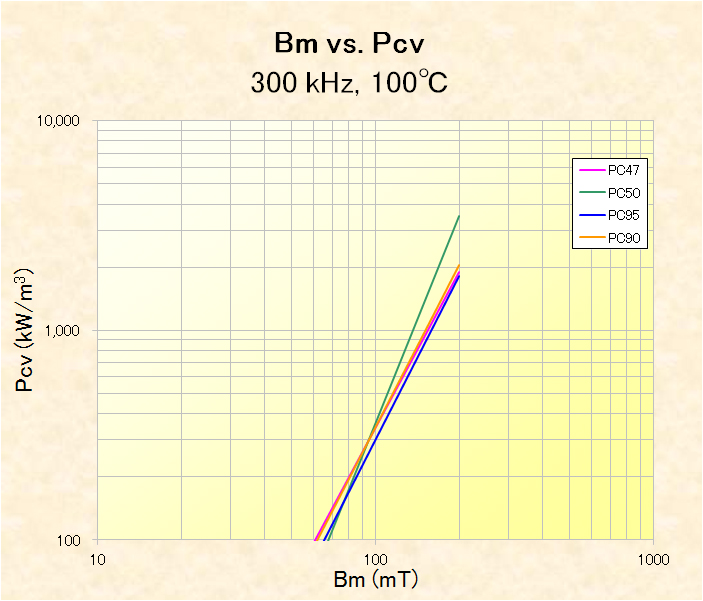
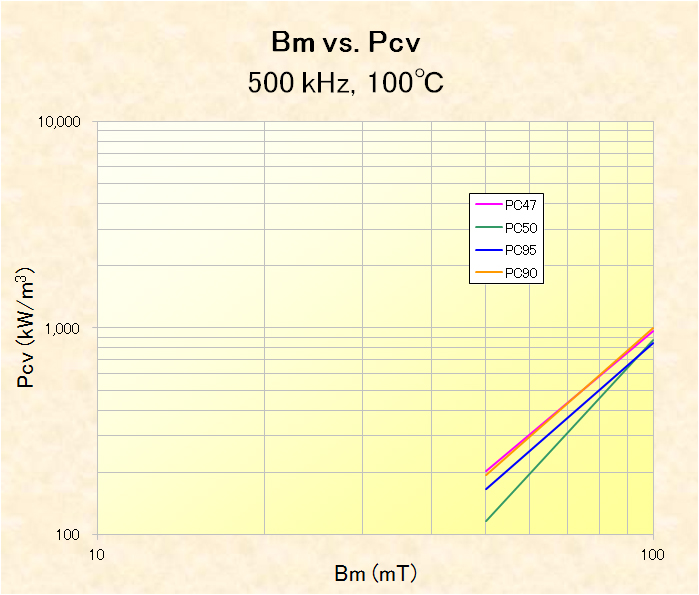
Following are three graphs showing this relationship. The graphs are measured at 100KHz, 300KHz and 500KHz and look at the core loss verses the flux density. Comments on the graphs:
- At 100 KHz, PC50/N49 shows higher losses than all the other materials. This is correct in that the material was designed to control Eddy Current losses. To control Eddy Current losses the grain size became smaller and more uniform allowing for a more tightly packed composition. This structure actually increased the hysterisis loss.
- At 300 KHz, we start to see the PC50/N49 material show lower losses than the other materials. The cross-over pooint where the PC95 shows lower losses is 75mT.
- At 500KHz, again we see PC95 becomming a better material where core losses are a concern. The cross-over point at 500KHz is about 95mT.
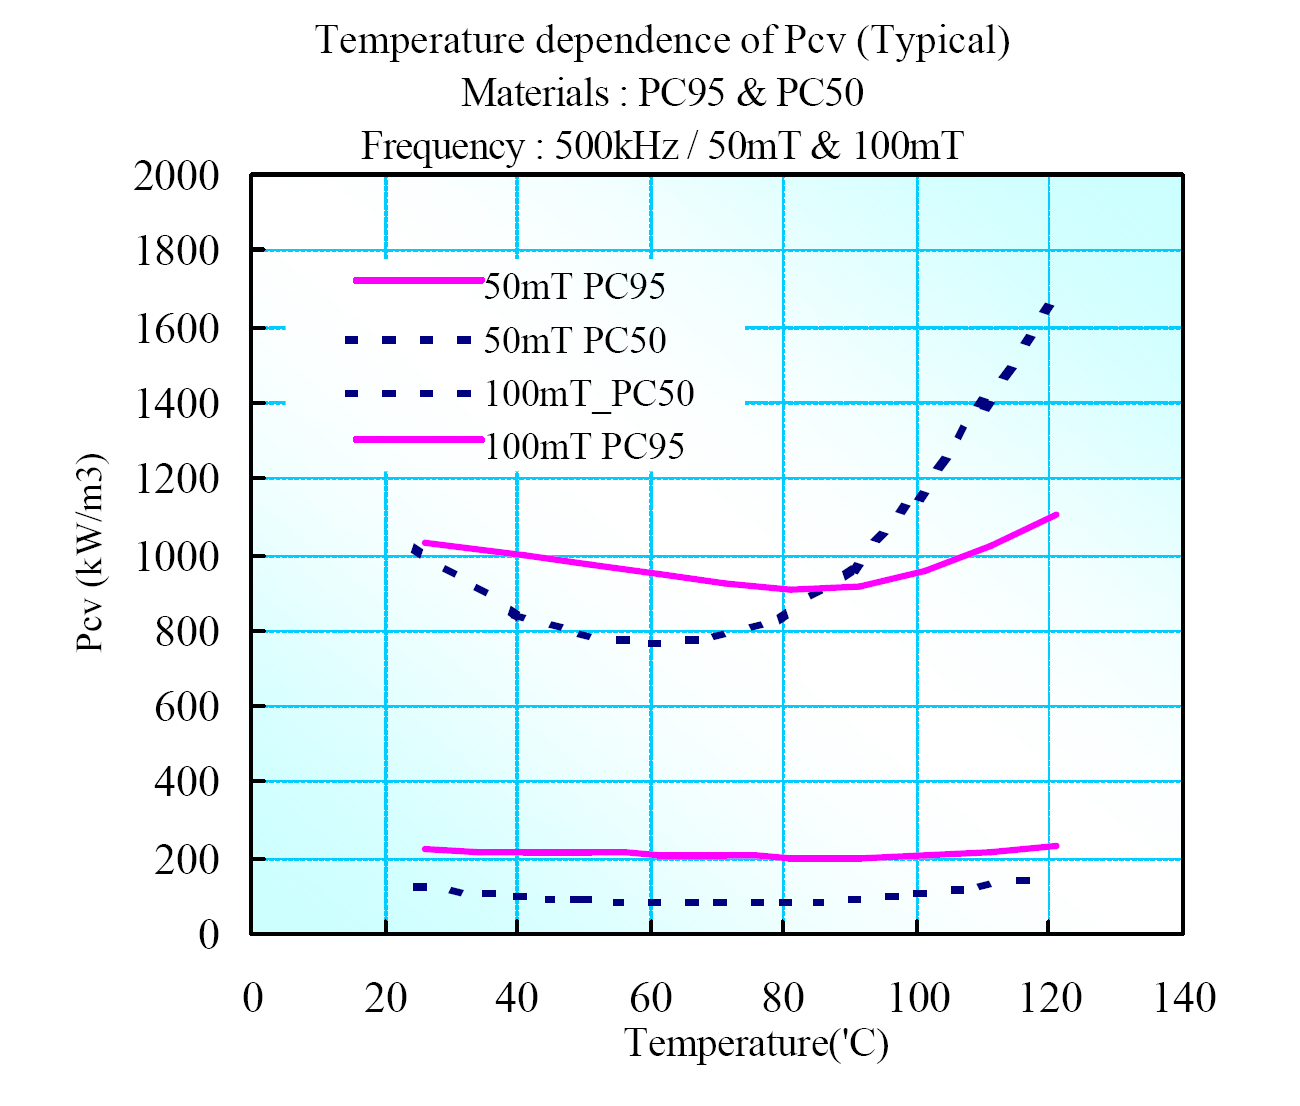
Lets continue looking at the PC50/PC95, specifically at 50mT and 100mT with varying temperature. We now have two additional graphs to look at.

